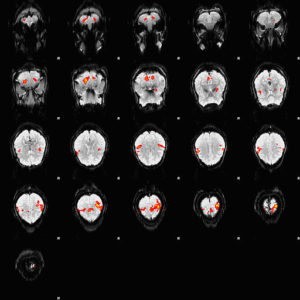
Try your hand at seeing finger tapping in an fMRI of the brain.
Image: Finger Tapping Experiment, By Zareshk via wikimedia commonsBy Zereshk (Own work) [Public domain], via Wikimedia Commons
How does a voxel provide the 3D image for a Functional Magnetic Resonance Imaging?
Since 1993, the Functional Magnetic Resonance Imaging has been available as a tool to study the brain. The photographer in the fingertapping experiment, Zareshk, describes the above photograph thusly:
An fMRI depiction of activated brain areas (BOLD) during an index finger-tapping sequence. Experiment and imaging was performed in our dept at RIC, at UTHSCSA. Analysis for activation depiction was performed by me using fsl. I used BET, FAST, and FEAT to obtain this image. The experiment was performed in the following method: Subjects performed a finger tapping sequence during a block design paradigm. This study focused on only right hand (unimanual) index finger. During the first 30 seconds the subjects moved their right index finger from side to side (adduction-abduction) at the rate of 2Hz, followed by a 30 second rest period. This sequence was repeated 6 times for a total of 6 minutes. A Gradient-Echo planar sequence was used with the parameters of TR=2s, TE=30ms, and a flip angle of 90° and sixteen continuous 6mm-thick axial slices, with an in-plane spatial resolution of 3mmX3mm.
An article at scientificamerican.com has described this experiment as follows.
[Above] is a picture of someone’s brain as seen through functional magnetic resonance imaging or fMRI. This particular subject is taxing his neurons with a working memory task—those sunny orange specks represent brain activity related to the task. fMRI images show the brain according to changes in blood oxygen level, a proxy for degree of mental activity. It’s a pretty amazing tool; it has validated a lot of assumptions about brain regions and helped us make comparisons between groups of people, shedding light on addiction, development and disease. Some scientists believe it can help us read minds (more on that later) or even predict the future.
But fMRI doesn’t actually provide detail at the level of a cell. The 3-dimensionsal image it provides is built up in units called voxels. Each one represents a tidy cube of brain tissue—a 3-D image building block analogous to the 2-D pixel of computers screens, televisions or digital cameras. Each voxel can represent a million or so brain cells. Those orange blobs in the image above are actually clusters of voxels—perhaps tens or hundreds of them.
fMRI is also too slow to capture all of the changes in the brain. Each scan requires a second or two, enough time for a neuron to fire more than a hundred times. That means it can’t provide a clear sense of precisely when things happen. Trying to explain whether activity in one spot causes activity in another is not possible through fMRI alone. Furthermore, you have to be careful with your conclusions. Just because voxels corresponding to one region ‘light up’ when your subject sees a terrifying tiger doesn’t mean that every time this region appears active, your subject is frightened. Many of the brain’s regions are quite complex and involved in multiple processes.
When we read about fMRI studies, it sounds as though spotting an active brain region is obvious, but it isn’t. Scientists have to sift through a mass of data and apply sophisticated statistical techniques to spot the voxels correlated to the activity. For example, say a scientists asks you to lie down in an fMRI machine and tap your finger, wait five minutes, then tap again. Mapping the movement of your tapping to active voxels is not as straightforward as it sounds. The raw fMRI data will likely show an eruption of signals. “You see this frothing cauldron with this little blip of extra activity,” says computer scientist Francisco Pereira, a researcher at Princeton University. There may be an extra blip when you moved your finger, but it need not have been a radical difference—perhaps just a five percent change in blood oxygen levels. Depending on the task, even a fraction of a percent change could be a strong signal. Luckily, through careful statistics, it’s possible to identify significant activity by comparing changes within each individual voxel when the finger was idle and when it was tapping. fMRI is a brilliant tool for generating these correlations, allowing you to observe associated activity in clusters of neighboring voxels—which correspond nicely to brain regions—as well as activity in more distant areas of the brain.
Read the full source article at scientificamerican.com
Image attribution: Wikimedia Commons
We’ve tried to clarify some basic science behind the semantic brain mapping endeavor reported in April, 2016, by scientists at UC Berkeley. We hope you found this reading useful and enjoyable.